
Moving averages have long been a popular trading strategy among Forex traders, both newbies and experienced ones. They are easy to use, understand, and provide clear trading signals to traders.
They are also quite powerful as they are following the underlying trend (most of the time, at least), which allows traders to trade in the direction of the trend.
With the popularity of moving averages came various technical tools that were using inputs from moving averages in their computing.
One of them is MADdash – a comprehensive tool that uses MAs to sort currencies by their strength. Here is a full overview of the indicator, how it works, and How to Use MADdash as Trading Strategy.
What is MADdash?
MADdash is a technical indicator (former Expert Advisor) that uses moving averages of different currency pairs to calculate what currency is the strongest and the weakest. The indicator then provides trading signals which consist of buying strong currencies vs weak currencies once certain conditions are met.
MADdash is easy to install and use. The indicator consumes an entire chart due to the large amount of data it includes. On the left-hand side of the indicator, you’ll find a tabular representation of the eight major currencies and various cross-pairs and their distance from moving averages on the 1-minute, 5-minute, 15-minutes, 30-minutes, and 1-hour timeframes.
As you can see, the indicator uses rather short timeframes, which makes its signals more suitable to traders who follow a scalping or day trading style.
Each row in a table gives a detailed overview of the currency pair and its distance from moving averages on the mentioned timeframes. The idea behind measuring the distance between the currency price and a moving average is based on momentum trading, i.e. the larger the distance between the price and the MA, the more likely it is that the pair will continue in the underlying direction. The reason for this lies in the herd-following behavior of market participants and the trending nature of markets.
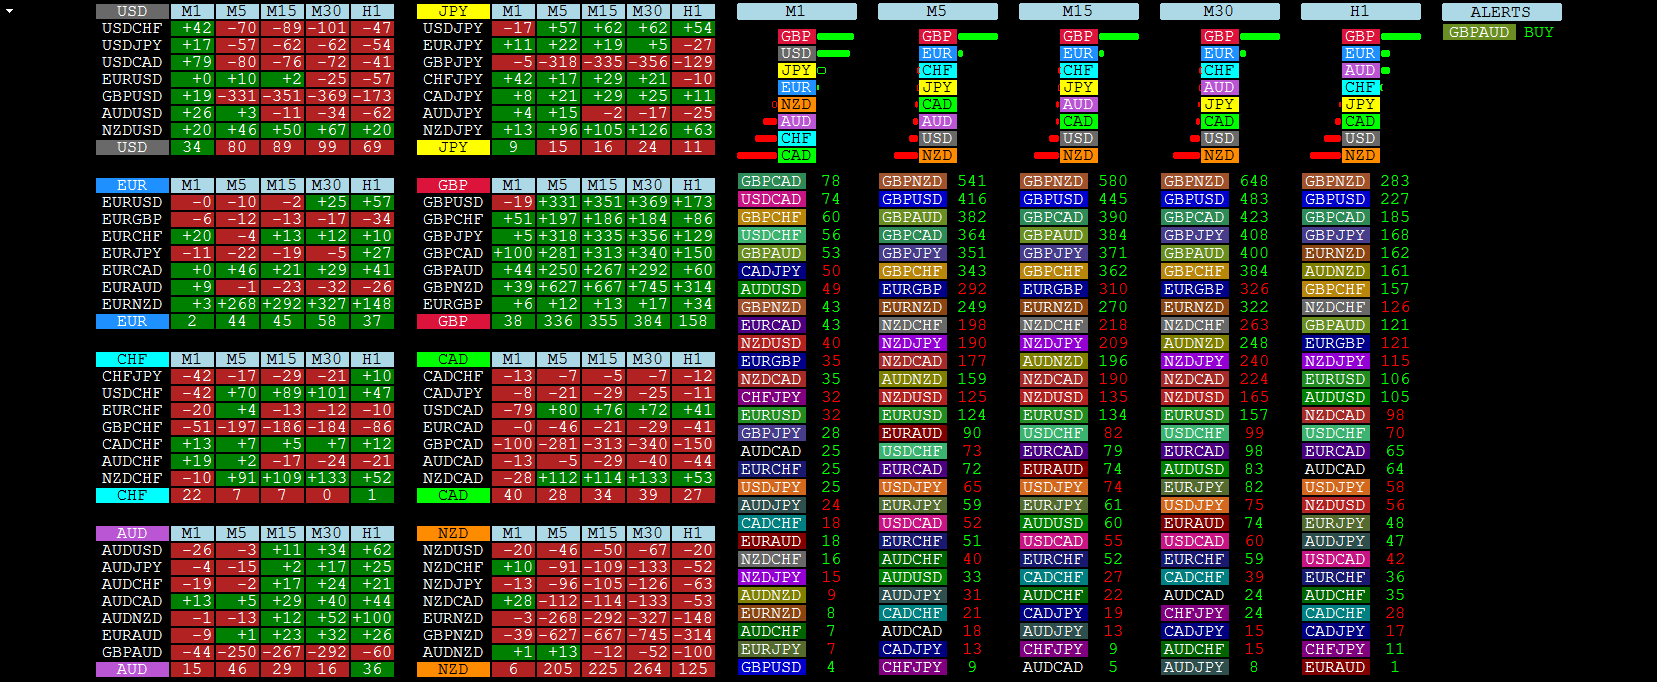
For example, in the screenshot above,you can see the distances from moving averages for major USD pairs in the first table on the left-hand side. For the USDCHF pair, the price is 42 pips away from the 1-minute MA, -70 pips away from the 5-minutes MA, -89 pips away from the 15-minutes MA, and so on.
By calculating the distances for each pair that includes the US dollar (major pairs) and taking the average value for each timeframe, the indicator calculates the strength of the US dollar (the last row in the USD table.) The wider the distance, the stronger or weaker the currency gets.
It’s important to note that the tables on the left-hand side of the indicator depict the actual distance from the MAs, while the values on the right-hand side of the indicator represent the derived distance from the MA using mathematical models. That’s why you’ll notice that the values between the two tables are not the same.
By repeating the calculations for each currency and currency pair, taking the average of the distances from the MA to the current exchange rate, the indicator is able to rank currencies from weak to strong and to match strong currencies with weak ones, and vice-versa.
Benefits of MADdash
Here are the key benefits of MADdash that makes the indicator a great trading tool.
-
Moving Averages
As their name suggests, moving averages are technical indicators that take the closing prices of a pre-defined number of previous candles, calculate the average price, and plot it on the chart. As new candlesticks form on the chart, the moving average indicator will automatically include the latest closing price and exclude the oldest closing price in its calculation.
For example, if you add a 10-period moving average to the EURUSD 1-hour chart, the indicator will take the closing prices of the last 10 1-hour candles and plot the average price on the chart. When a new candlestick closes, the indicator takes the new closing price and excludes the closing price from 10 hours ago, which is the “moving” component of the indicator.
There are two main types of moving averages: simple moving averages (SMAs) and exponential moving averages (EMAs). A simple moving average takes the arithmetic mean of a pre-defined number of previous candles to calculate the average price, while an exponential moving average takes the geometric mean of a pre-defined number of previous candles to calculate the average price.
As a result, EMAs are more sensitive to recent price changes compared to SMAs, which helps to reduce the lag that is common when trading with technical indicators.
The MADdash indicator takes advantage of the underlying trend represented by MAs across different timeframes and the momentum they create to find profitable trading opportunities in the markets. Markets tend to have inertia after a strong price-move, which makes it more likely for the underlying trend to continue than to reverse in the short term. This the basic principle of trend-following trading strategies that are based on moving averages, including the MADdash indicator.
-
Momentum Trading
When trading with moving averages, traders usually use one of two trading strategies: MA crossover and MA momentum trading. The first strategy is based on a crossover of a faster MA above or below a slower MA (note: faster MAs are those that have a shorter lookback period).
The second strategy, which is more interesting to us in the context of MADdash, is MA momentum trading. This strategy takes advantage of increased buying or selling pressure and momentum build-up after the price crosses above or below a moving average. Since many traders place their stop-loss and take-profit levels around important MAs, such as the 50-hours MA, the price tends to break those levels on high momentum. MADdash takes advantage of the momentum in the markets.
-
Strong vs Weak Currencies
MADdash is designed to rank currencies by their strength, from the strongest to the weakest ones. You can check the strength of the major currencies on the right-hand side of the indicator, where the strongest and weakest currencies are sorted by timeframe. In essence, the strongest currencies are those that show the greatest distance above an MA, while the weakest currencies are those that show the greatest distance below an MA.
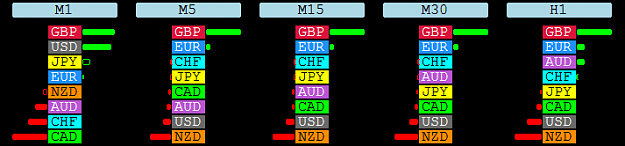
The screenshot above, for example, shows that the British pound is the strongest currency across all timeframes – from the 1-minute one to the 1-hour TF. The New Zealand dollar is the weakest currency from the 5-minute to the 1-hour TF, while the Canadian dollar is the weakest only on the 1-minute TF.
How to Use MADdash as Trading Strategy?
Trading with MADdash is quite easy as the indicator provides real-time trading signals based on the current strength of the major currencies. The signals are displayed beside the currency strength table, and looks something like this:
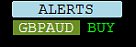
The alerts are based on the performance of the currencies on the 1-minute and 5-minutes timeframes.
At the moment, the first rule is this: On the 1-minute timeframe, when the base currency crosses above or is equal to the alert threshold AND the quote currency is below or equal to the alert threshold, we have our first trading signal.
The second rule is based on momentum on the 5-minutes timeframe, i.e. the price-action on the 5-minutes timeframe needs to show greater momentum than the price-action on the 1-minute timeframe. Combined with the first trading signal, this second rule provides the final trading signal displayed on the Alerts section of the indicator.
-
Trading Based on Currency Strength
The easiest way to trade on MADdash is to match strong vs weak currencies and follow the indicator’s alerts. Currencies that are strong on the 1-minute and 5-minute timeframes tend to remain strong during the next hour, while currencies that are weak on the short-term timeframes tend to remain weak in the near future. The reason behind this lies in market fundamentals.
If a fundamental catalyst increased the demand for or supply of a currency, it’s very unlikely that the market will reverse shortly after the catalyst (news or market report) has been released. By trading the indicator’s alerts, you can take advantage of that momentum in the markets.
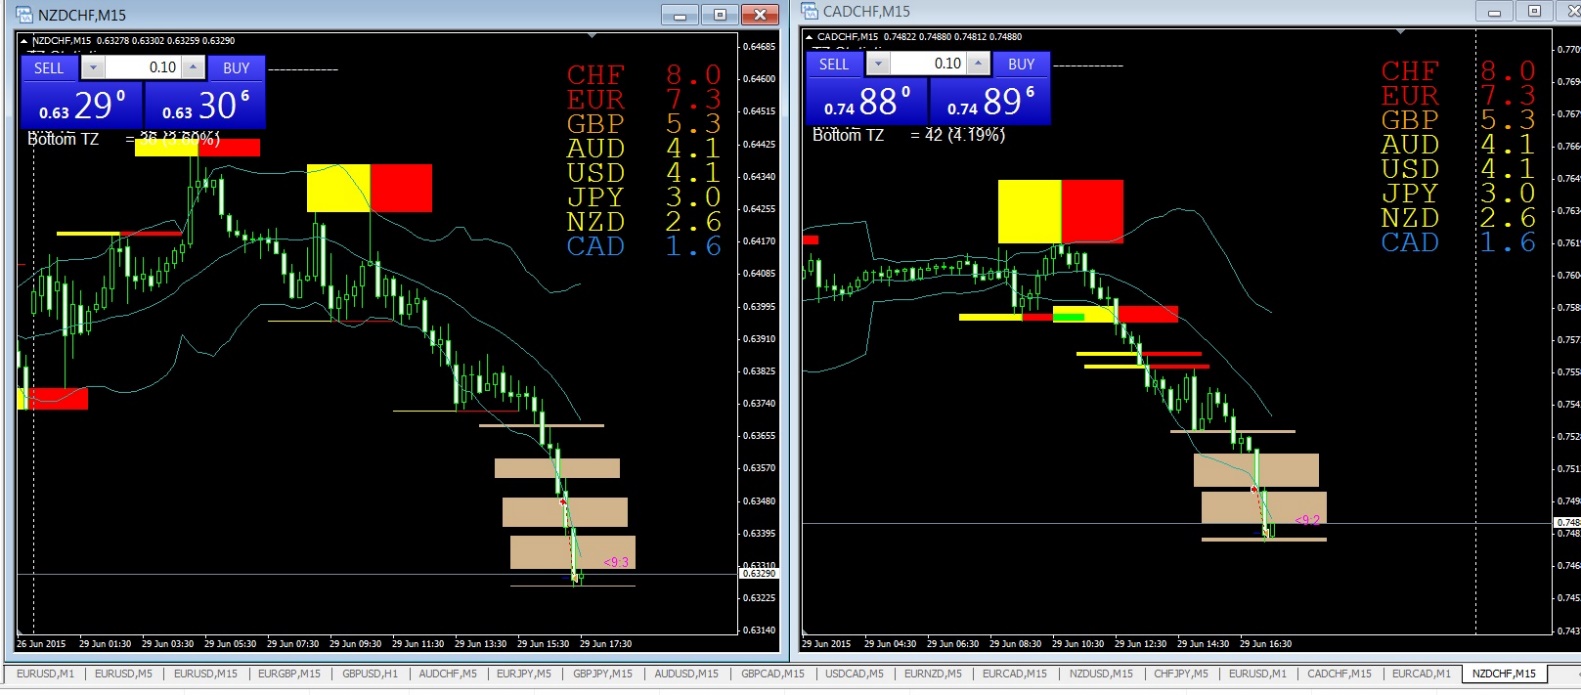
he screenshot above shows two trades, one in NZDCHF and the second in CADCHF. Notice that the Swiss franc is the strongest currency and the Canadian dollar is the weakest currency, followed by the New Zealand dollar as the second weakest currency.
This information leads to two simple trades: Short NZDCHF and Short CADCHF. Both trades moved immediately in our favor.
2. Pullback/Retracement Trading
Another way to trade the MADdash indicator is to wait for pullbacks/retracements in the market before entering into a trade. After identifying strong and weak currencies, wait for a counter-trend move in the opposite direction to enter into the trade.
Although many traders believe that trading based on MAs is lagging (it is to some extent), it can also be forward-looking if an MA provides support or resistance in a counter-trend move.
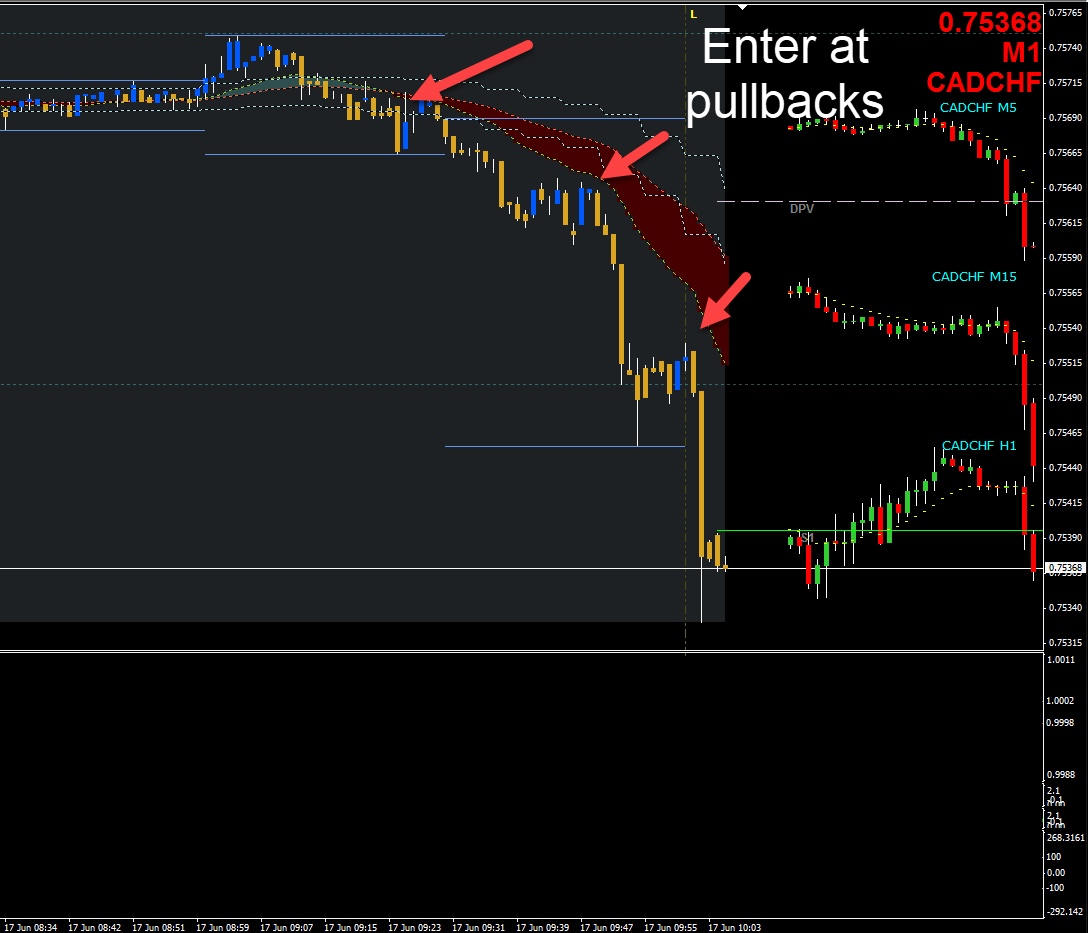
The chart above shows how pullbacks provided great entry opportunities in the CADCHF pair, followed by strong moves to the downside. Pullbacks allow you to reduce your risk and increase your reward-to-risk ratio when trading.
3. MA Crossover Trading
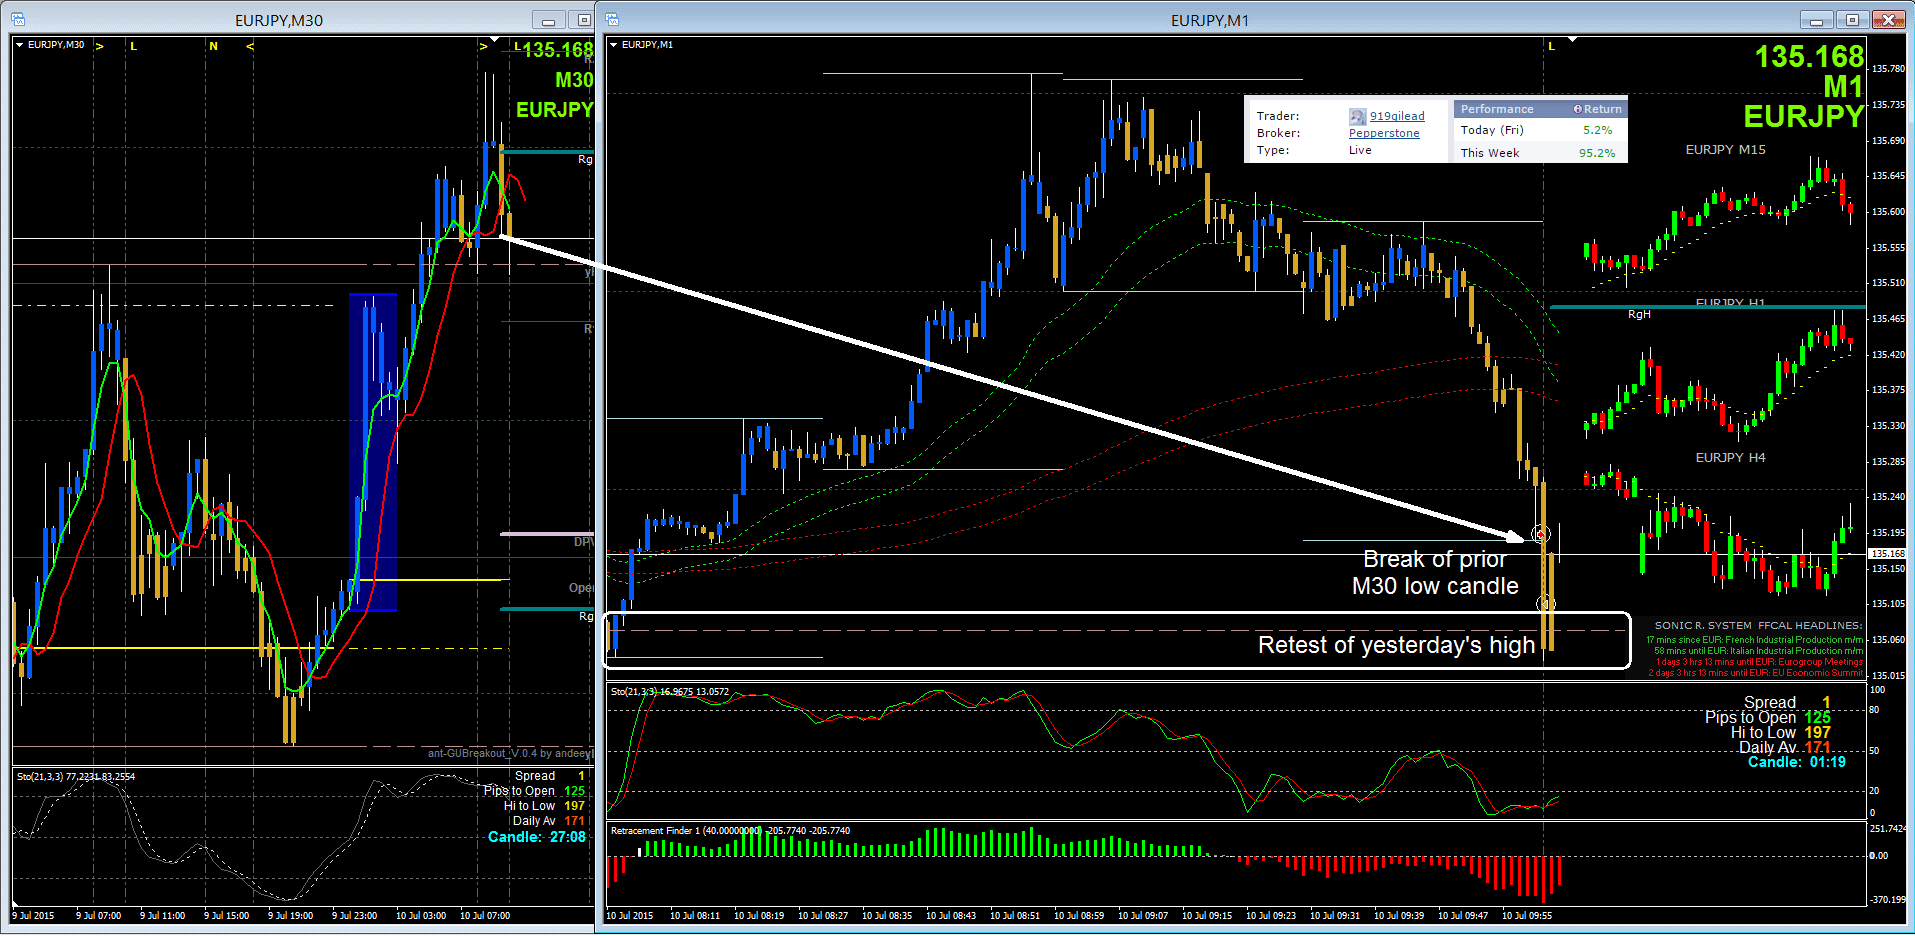
Last but not least, you can use the MADdash indicator to trade MA crossovers. All you have to do is to tweak the indicator’s settings by changing the MAs and TFs so that they display a MA crossover, i.e. two MAs of different lengths. The chart below shows the EURJPY pair with the indicator tweaked to show two MAs of different duration.
Combined with the indicator’s table that shows the strongest and weakest currencies, the MA crossover strategy allows you to fine-tune your entry points and squeeze additional profits out of the market.
The left chart shows the 30-minutes chart, while the right chart shows the 1-minute chart. Notice the MA crossover on the 30-minutes chart which formed a great selling opportunity in the EURJPY pair. By zooming in into the 1-minute chart, you can additionally fine-tune your entries and manage your risks.
What are the Weaknesses of MADdash?
Just like with other technical indicators that are based on moving averages, the major weakness of MADdash is the lagging nature of moving averages. Although MAs can sometimes by leading indicators (such as when trading pullbacks to MAs), they’re still lagging the price-action most of the time. MAs use past closing prices to plot the MA line on the chart, which makes them less sensitive to new market information, even if you’re using EMAs.
To overcome this weakness, MADdash did a great job by combining multiple short-term timeframes in the calculation of its trading alerts. The included timeframe range from the 1-minute TF to the 1-hour TF, making it a great indicator for scalpers and day traders who want to bring their trading to the next level.
Another weakness of MADdash is that the indicator doesn’t provide exact entry and exit levels. Fortunately, this can be easily done by placing your stop-loss levels at recent swing highs or swing lows, placing your profit targets at 2x your stop-loss, using horizontal support and resistance levels to define your risk and exit targets, etc.
Final Words
The MADdash indicator is a very comprehensive technical indicator that is based on moving averages. The indicator calculates the distance of each major currency from its underlying moving average, spanning from the 1-minute to the 1-hour timeframe. After taking the average value for each timeframe and currency, the indicator calculates and displays the strongest and weakest currencies across the mentioned timeframes.
The typical use of the indicator is to combine strong and weak currencies by going long the strongest currency and simultaneously shorting the weakest currency. For example, if the US dollar is the strongest and the AUD is the weakest, a trader would short the AUD/USD pair. Pullbacks to MAs and MA crossovers can also be used to fine-tune your entry points and increase your trading performance. Simply play with the indicator for a few days and tweak its settings to find the best trading setups for your trading style.