
Many new traders to the forex market start experimenting with various forex indicators in their beginnings, making their trading platform look like a Christmas tree. However, I can’t blame them as I’ve started trading the same way. My charts were cluttered with technical indicators, and I could barely see the price chart itself. I was obsessed with finding overbought and oversold areas on the indicators, divergences, and other trading signals that should give me an edge in trading and hopefully help me become profitable.
Trading this way, I broadened my horizons and gained useful experience on how forex indicators work, at which times they provide viable trading signals, and what their drawbacks are. In this article, I’ll cover the pros and cons of trading with forex indicators, briefly cover the Elliott Wave theory and Fibonacci trading, and show you how you can improve your technical trading. So, let’s get started.
How do Forex Indicators Work and Should You Trade on Them?
Forex indicators can broadly be grouped into two categories: lagging indicators and leading indicators. Lagging indicators, as their name suggests, lag the price and are best used to confirm a trade setup. Leading indicators, on the other hand, try to forecast where the price is heading in the future. Of course, one might think that leading forex indicators are the “holy grail” and everything that is needed to be a profitable trader. Unfortunately, this isn’t the case. Leading indicators create many false signals along the way, and serious traders know how to filter the good signals from the bad ones to avoid accumulating losses.
Another classification of forex indicators is based on what they measure. According to this, forex indicators can be grouped into trend indicators, momentum indicators, and volatility indicators.
Trend indicators try to calculate the current direction of the market, which can be upwards, downwards, or sideways. The most popular trend indicators are moving averages, ADX (average directional index), MACD, and parabolic SAR.
Momentum indicators, as their name suggests, measure the momentum of the market, i.e. the speed at which the market is moving in a period of time. Momentum indicators include the RSI, Stochastics, and CCI, among others.
And finally, volatility indicators measure the volatility of the currency pair, which is the speed at which the exchange rate is changing. Highly volatile markets (i.e., markets where the price is changing fast) create many trading opportunities, and traders literally live on volatility. Volatility indicators include Bollinger bands, ATR (average true range), and Envelopes, to name the most popular.
Now that you know what the most popular forex indicators are and what they’re used for, it’s time to shed some light on the way all the indicators work.
Forex indicators use mathematical formulas and historical price data to calculate the trend, momentum, or volatility of a currency pair. Naturally, as future price data is still not available, historical data is the only usable input for forex indicators. This creates the main problem of forex indicators: using historical data to predict future price action with mathematical formulas has its many disadvantages, and false signals can therefore not be avoided.
The Elliott Wave Theory – How to Filter Your Technical Signals
The Elliott Wave Theory, developed by Ralph Nelson Elliott in the late 1920s, can be used to get a bigger picture of the market and to not get caught by the false signals that forex indicators may generate. The Elliott Wave theory states that the market can be described in an organized way with “cycles” and “waves”, and that investors’ behavior and the psychology of the masses influence how the market behaves.
According to the Elliott Wave Theory, a market cycle consists of 5-3 moves. The first five moves (from 1 to 5) go in the direction of the main trend, and are called impulsive or motive waves, while the remaining three moves (A-B-C) go against the main trend, and are called corrective waves. Inside each of the waves, another 5-3 move pattern can be found, which repeats itself to the infinity. This concept is shown on the next picture:
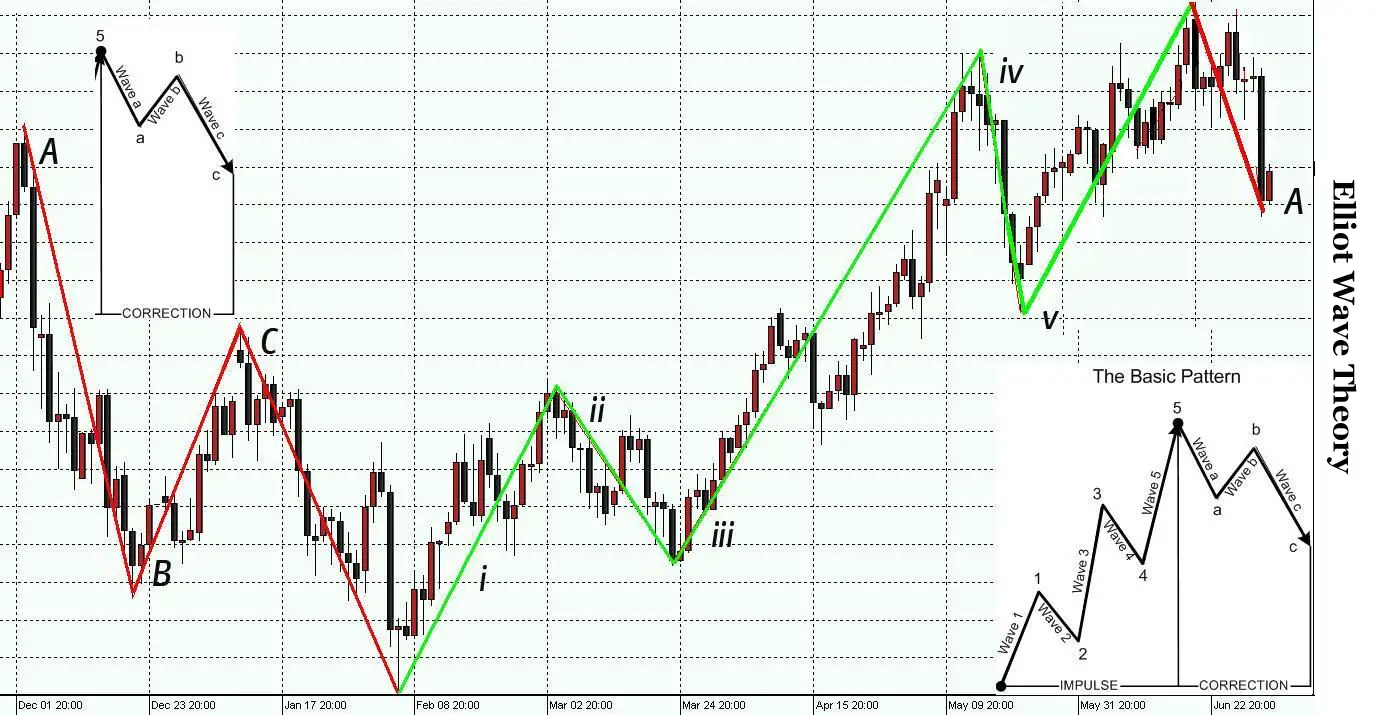
If you know where the market currently stands according to Elliott’s cycles and moves, you can filter the bad signals out of the forex indicators and only take the trades which are inline with the current market cycle. We’ll see later how to take advantage of Elliott Waves.
What You Need to Know About the Most Popular Forex Indicators
-
MACD – Moving Average Convergence Divergence
The MACD (Moving Average Convergence Divergence) indicator is trend-following forex indicators that is based on two moving averages of prices – a slower and a faster one. The 26-day EMA is used as the slow MA, and the 12-day EMA is used as the fast MA. The MACD subtracts the two EMAs and compares the resulting line with a third, 9-day EMA, which is called the signal line.
How to Trade the MACD Indicator?
The following chart shows an example of the crossover and divergence MACD strategy. Basically, by the crossover strategy, you look for the cross of the MACD above or below the signal line, which gives a buy or sell signal. Please note that some platforms may have a slightly different look of the MACD indicator with two lines, and where a cross of the lines sends a buy or sell signal.
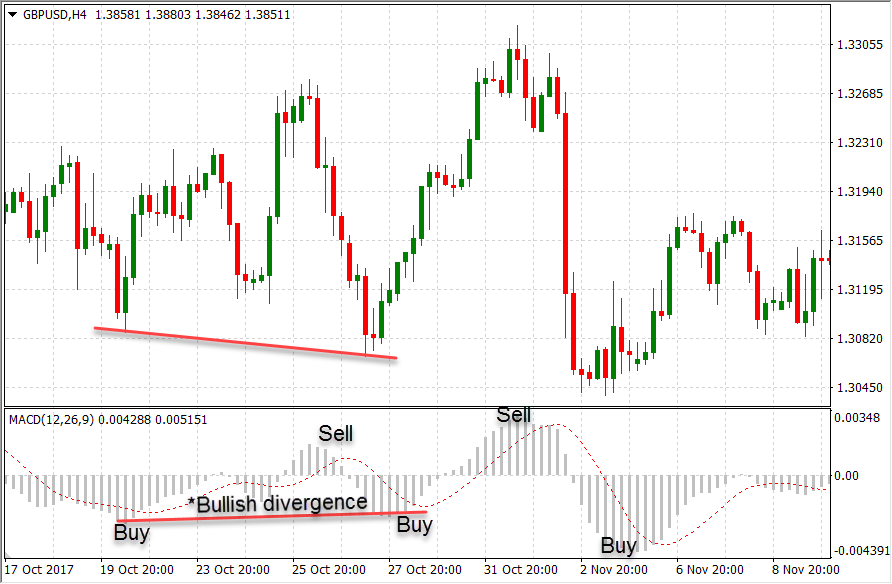
In addition to the crossover strategy, the MACD is popularly used for identifying bullish and bearish divergences, as shown on the chart above. A bullish divergence forms when the indicator makes a fresh higher low while the price makes a fresh lower low, which sends a strong buy signal. Similarly, a bearish divergence forms when the indicator makes a fresh lower low, while the price makes a new higher low, and indicates a sell opportunity.
-
Stochastics
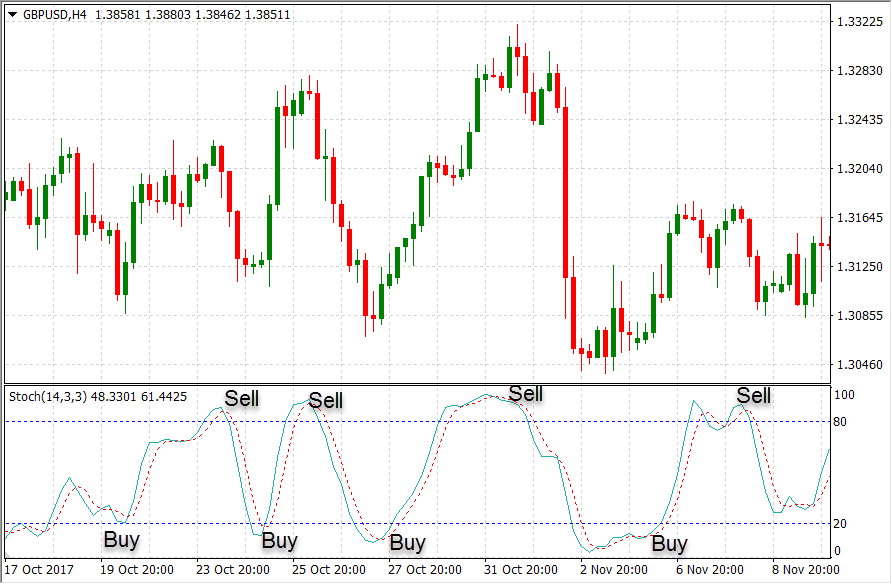
Stochastics is a momentum indicator that compares the closing rice of a currency pair with the range of its previous prices over a predetermined period of time. A shorter period setting creates a more volatile stochastic indicator, while a longer period setting creates a less volatile indicator.
- %K = 100(C – L14) / (H14 – L14)
- C – most recent closing price
- L14 – the lowest price of the 14 previous sessions
- H14 – the highest price of the 14 previous sessions
A 3-period moving average of the %K is also used for trading signals, specifically the crossover of the %K with its 3-period MA, called %K.
The basic premise of the stochastic indicator is that, in times of upward trends, the closing price will be near the recent sessions’ high, while in times of downward trends, the closing price will be near the recent sessions’ low.
How to Trade the Stochastic Indicator?
The stochastic indicator is mostly used to identify overbought and oversold levels and to trade on them. The usual levels to identify those market conditions are below 20 for oversold, and over 80 for overbought. Basically, when the indicator goes overbought, it indicates that the current price may correct and fall in the near future, while an oversold condition indicates a possible rise in the price. This is shown in the following chart, with the corresponding entry signals to buy and sell. When the indicator is oversold, the buy signal is the return of the indicator inside the “normal” levels (above 20), while a sell signal occurs when the indicator returns from an overbought level to normal levels (below 80).
-
RSI – Relative Strength Index
Another very popular momentum indicator is the RSI (relative strength index) indicator, created by Welles Wilder. The RSI indicator compares the magnitude of recent price changes to measure the speed of price movements of currency pairs over a certain time period. Just like the stochastics indictor, the RSI is mostly used to identify overbought and oversold levels of a currency pair.
The RSI is calculated using the following formula:
RSI = 100 – 100 / (1 + RS)
Where RS is equal to the average gain of up periods, divided by the average loss of down period during a specified period of time (the default setting is 14 trading days).
How to Trade the RSI Indicator?
As with the stochastic indicator, the RSI is primarily used to identify overbought and oversold market conditions. But keep in mind that both the RSI and stochastics can also be used to find and trade divergences between the indicator and the price, just like with the MACD.
The standard overbought and oversold levels for the RSI are 80 and 20, respectively. However, some traders lower that threshold to 70 and 30, in order to get more trading signals out of the RSI. The following chart shows the RSI entry signals based on the 70 and 30 levels for overbought and oversold conditions.
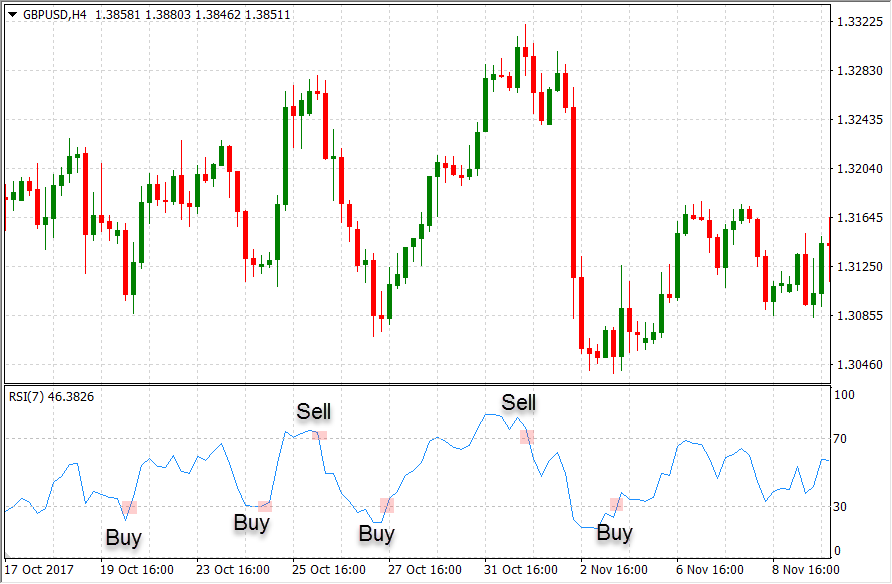
Once the indicator moves above 70 and gets overbought, we need to wait for the return to normal levels and enter with a sell position when the indicator crosses below 70. Similarly, we wait for the indicator to return to normal levels and cross above 30 after an oversold condition to enter with a buy position.
How to Improve Your Technical Trading?
Technical indicators, such as the MACD, stochastic, or RSI, do create false signals from time to time. This drawback of technical trading is especially emphasized during times of rapid price movement, when many indicators may trigger a buy or sell signal although the result of the suggested trade is going to be lost. For example, if the exchange rate of a currency pair rises dramatically following a major news release or a shift of fundamental forces, both the RSI and stochastics (or any other momentum indicator) may become overbought or oversold and trigger a sell or buy signal, respectively. But, the underlying momentum of the move may persist in its initial direction, hence the trades that were solely based on technical signals would not be profitable.
To filter good and bad technical signals, traders need to use additional confirmation tools for their entries. For example, one might combine lagging and leading indicators for confirmation purposes, or only trade in the direction of the overall trend. This means, if the trend of a currency pair is up on the daily or 4-hour chart, you would only enter with buy orders once your preferred indicator enter an oversold level – and if the trend is pointing down, you would look for short entries when the indicator becomes overbought.
In addition, knowing the bigger picture of market cycles and moves as the Elliott Wave Theory suggests, would give you a good indication of where the market currently stands (impulsive 1-5 move, or corrective A-B-C move), allowing you to only enter in the direction of the next Elliott move.
Besides Elliott Waves, another popular tool – Fibonacci retracements – may be used to decide whether you want to enter with a buy or sell order based on the signal of your forex indicators. This means, if the price approaches a major Fibonacci retracement level, such as the 23.6% or 38.2% levels, you would look for technical signals that point in the direction of the underlying main trend (as Fibonacci retracements indicate price corrections levels, i.e. potential support & resistance levels).
-
Have Confidence in Your Strategy
Having confidence in your strategy means that once you enter your trade, you don’t move your stop-loss and take-profit orders, or close your positions too early fearing that the price might go against you. There is no way to build confidence in your technical strategy without taking a number of trades and analyzing their results. There is no trading strategy that is profitable 100% of the time – but to give your trading strategy a chance to show any kind of profitability, you need to be persistent and build confidence in it over a longer period of time.
-
Don’t Follow the Masses
It’s easy to get swept away by the mainstream media and general opinion, but we as forex traders have to practice analyzing the market in our own way. It’s absolutely alright to have an opinion that differs from the overall sentiment on a currency pair, and the most notorious traders have always been independent thinkers. Take George Soros for example. He shorted the British pound when the general opinion was that the Bank of England would defend all selling pressure on the sterling, and the rest is history.
Conclusion
In this article, we covered the most popular technical indicators and their corresponding strategies: the MACD, Stochastics and RSI. Make sure not to blindly follow their signals, as technical indicators are notorious to return fake signals in times when the price makes large up or down swings. This is why we need other confirming signals to enter the trade, as discussed in the lines above. If you’re a technical trader, fine-tuning your entry and exit points is of crucial importance and confirmations based on lagging indicators, the overall market trend, Elliott’s cycles and moves of Fibonacci retracement levels can provide you the edge in trading to ultimately become a successful trader.